Tempo and Fertility
The period level of fertility is commonly measured by the Total Fertility Rate (TFR), which is readily available for almost all European countries.
However, the period TFR is sensitive to changes in the age at childbearing. In most European countries, women have been shifting births to higher ages for several decades. This postponement of childbearing lowers the number of births in a given period and thus depresses the TFR even if the number of children that women have over their entire life course does not change. This tempo effect can also be envisaged as an expansion of the interval between generations that results in fewer births per calendar year. In addition, the TFR is also affected by changes in the parity composition (i.e. the number of children ever born) of women of reproductive ages.
Alternative indicators were proposed to obtain a better measure of the average number of children per woman in a period perspective. Ever since its first publication in 2006, the European Demographic Data Sheet has used the tempo-adjusted TFR (TFR*), an indicator proposed by Bongaarts and Feeney (1998) that is based on birth order-specific total fertility rates and mean ages at birth . As of the previous (2012) edition the data sheet utilises tempo and parity-adjusted total fertility (TFRp*), a more recent indicator first introduced by Bongaarts and Feeney (2006) and elaborated by Bongaarts and Sobotka (2012). The TFRp* offers several improvements over the previous measure. It takes into account the parity composition of women of reproductive age and thus controls for an additional source of distortion in the conventional TFR. Moreover, it yields considerably more stable results than the TFR*, which is clearly illustrated in the three country graphs shown here. However, the limited availability of detailed data is an obstacle to its use. Wherever possible, we show the results for the TFRp* for 2010, which were computed for 21 European countries, the United States and Japan. For the countries lacking the required data, the current data sheet features the TFR* or its estimate, averaged over the 3-year period of 2009–2011 (indicated by an asterisk).
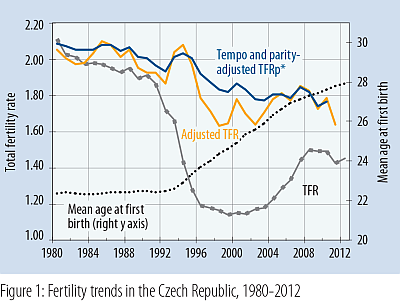
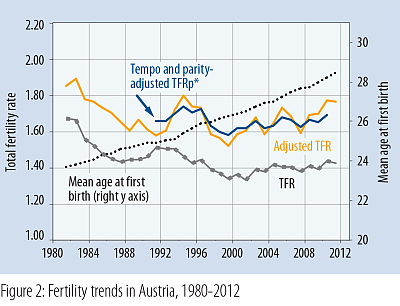
Figures 1–3 illustrate trends in the conventional TFR and its alternatives in 1980–2012 in three European countries with different fertility patterns. The graphs also show differences between the two tempo-adjusted indicators, TFR* and TFRp*. The values are mostly similar, but the TFR* clearly suffers from considerable year-to-year instability. The graphs also depict the long-term course of fertility postponement as measured by the rise in the mean age at first birth and, in the Czech Republic and Spain, reversals of the TFR trends after the onset of the economic recession in 2008.
In the Czech Republic the intensive shift to later childbearing after 1990 resulted in a dramatic fall of the period TFR to 1.14 in 1999, followed by its subsequent recovery to 1.4–1.5. In contrast, the TFRp* declined gradually, reaching levels around 1.8 since the late 1990s. This shows how much the TFR can be depressed when women postpone childbearing to later ages.
In Austria, the postponement of childbearing started earlier but progressed more gradually. The TFR and the TFRp* have shown relatively stable values since the mid-1980s, hovering around 1.4 and 1.6-1.7, respectively.
Spain shows yet another pattern: conventional and adjusted total fertility both fell in tandem in the 1980s and 1990s. The decline in the period TFR bottomed out at 1.15 in 1998 and modestly recovered until 2008, whereas the TFRp* continued to decline until 2007 and briefly converged with the TFR level before rising sharply in the subsequent two years.
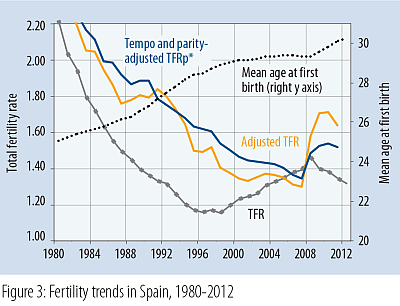
Most recently, fertility trends have been affected by the economic recession, bringing an acceleration of the shift towards later first births and a renewed decline in the period TFR. Thereafter the TFRp* shows a short-term upswing, which is even more pronounced in the trend of TFR*. This increase is likely to be caused by a rapid change in the variance of fertility schedule in recent years, which can temporarily distort the adjusted measures of fertility, especially TFR* (Zeng Yi and Land 2001).
References:
Bongaarts, J. and G. Feeney 1998. On the quantum and tempo of fertility. Population and Development Review 24(2): 271-291.
Bongaarts, J. and T. Sobotka 2012. A demographic explanation for the recent rise in European fertility. Population and Development Review 38(1): 83-120.
Bongaarts, J. and G. Feeney 2006. The quantum and tempo of life cycle events. Vienna
Yearbook of Population Research 2006: 115-151.
Zeng Yi and K. C. Land. 2001. A sensitivity analysis of the Bongaarts-Feeney method for adjusting bias in observed period total fertility rates. Demography 38(1): 17-28.