Re-measuring ageing in Europe
Most studies of population ageing focus on only one characteristic—people’s chronological age—and in those studies, “old age” is typically assumed to begin at 65. The implicit assumption is that all other characteristics relevant to population ageing do not change over time and place. For example, the conventional old-age dependency ratio (OADR) is defined as the ratio of the number of people 65 years or older to the number of people aged 20 to 64 years:
OADR = number of people aged 65+ / Number of people ages 20–64
Sometimes the proportion of people 60+ is used in the numerator, sometimes 15 is used as the lower bound for the age of people in the denominator, or sometimes the ratio is multiplied by 100 but whatever age is used as a threshold for being old, it is always considered to be fixed in time and space.
However, using a fixed chronological age as an “old age” threshold is misleading. Indeed, many important characteristics of people vary with age, but age-specific characteristics also vary over time and differ from place to place. At any given chronological age, the remaining life expectancy, health and morbidity, disability rates, cognitive functioning and many other characteristics of people are very different today from what they were 50 years ago or from what they are going to be 50 years from now. At each chronological age, these characteristics are different in different regions of the world.
Thus, using the OADR as an indicator of ageing for comparative purposes over a long time span creates a biased measure. By ignoring likely future gains in life expectancy and health, among other relevant dimensions of ageing, it produces a series that increases too rapidly.
One of the new measures of ageing introduced by scientists from IIASA and VID is based on remaining life expectancy. It is called the prospective old-age dependency ratio. The threshold of being old is no longer fixed here but changes with the change in life expectancy and is based on a constant remaining life expectancy. We assume here that people are old when the average remaining life expectancy in their age group is less than 15 years (see the maps below):
POADR = Number of people older than the old-age threshold /
Number of people aged between 20 and the old-age threshold
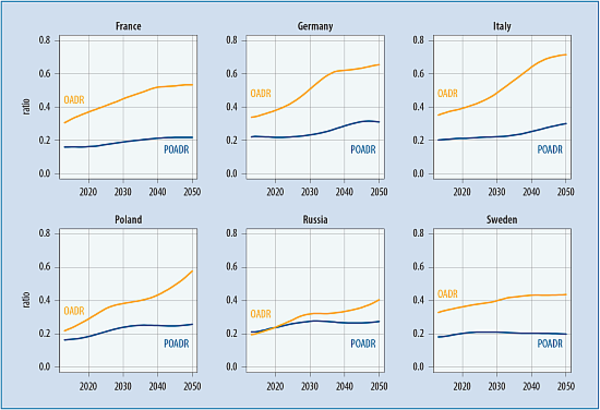
The figure at the top of this page shows the projected OADR and POADR for six European countries. Once the threshold of being old is based on remaining life expectancy, the picture of ageing looks very different and much less gloomy: by 2050, POADR is half the magnitude of the OADR in most of the cases. In addition, adjusting for life expectancy levels indicates that there is much less diversity between eastern and western Europe than as it appears without this adjustment. In general, ignoring differences in the characteristics of people over space and time produces misleading measures of ageing which can lead to inappropriate policies.
Further reading:
Sanderson, W. and S. Scherbov 2005. Average Remaining Lifetimes Can Increase As Human Populations Age, Nature, Vol. 435: 811-813.
Sanderson, W. and S. Scherbov 2010. Remeasuring aging. Science 329: 1287-1288.
Sanderson, W. and S.Scherbov 2013. The characteristics approach to the measurement of population aging, Population and Development Review, 39(4): 673-685.
New measures of population ageing at: www.reaging.org/indicators