Signal Recording
The STx Recorder is supplied with a level meter. Digital recordings allow no overload at all. For that reason it is extremely important to adjust the signal input level to -12 dB in average, providing enough headroom for signal peaks.
The normal recorder can use all standard windows audio devices. A special recording script for ASIO devices with up to 128 channels is included in the program package.

Real Time Spectrum Analyser
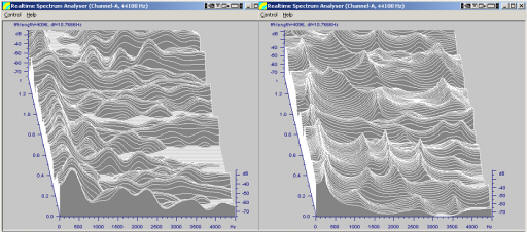
STx provides a 2-channel Real Time Analyser (RTA) to be called either as a stand alone application or additionally in combination with the STx-Recorder. The RTA offers the following functions:
- FFT-Amplitude Spectrum (STFT), Waterfall display and Spectrogram
- Linear Prediction Coding (LPC) - smoothed spectrum, Waterfall display and Spectrogram
- Cepstrum smoothed spectrum , Waterfall display and Spectrogram
- Display amplitude spectrum minus Cepstrum smoothed spectrum (cp & sp.-cp).
- Display amplitude spectrum channel A and channel A-B
- Linear and BARK frequency scaling
- Selection of FFT-frame length (frequency resolution) and overlap (hopsize) over large ranges
- Linear and Exponential Spectrum Averaging
- Waveform display.
- Selection of input device and source channel configuration
- Special graphic prensentation modes (full screen, no frame, etc.)
- Variable color scale and graphics properties
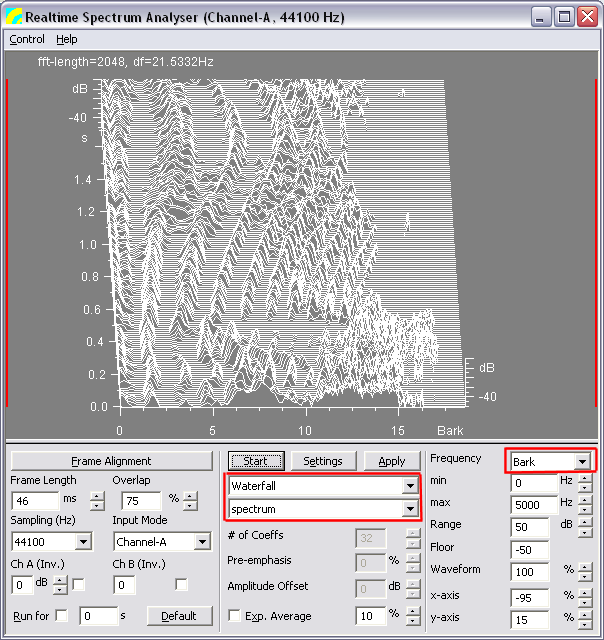
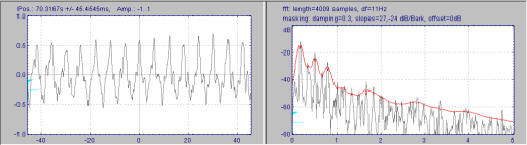
Waterfall Display (Frequency axis in BARK).
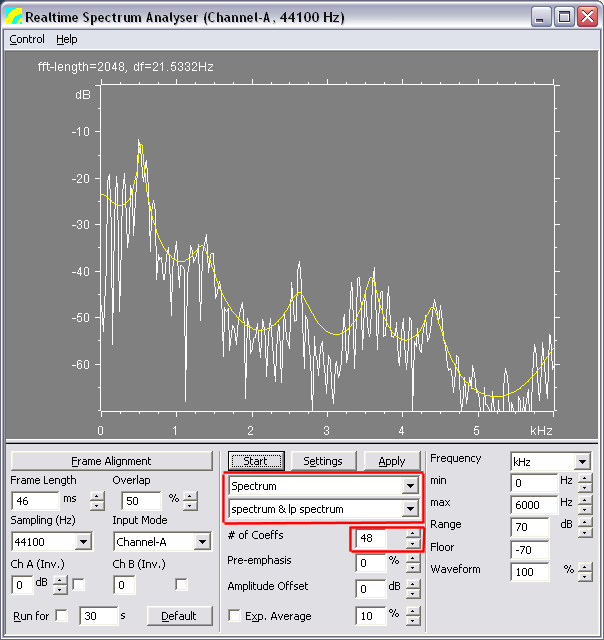
FFT Amplitude Spectrum (white) with LPC-smoothed spectrum overlayed (yellow)
Note: the LPC-spectrum represents the all-pole model of unnasalized voiced speech signals. The spectral peaks indicate the resonance frequencies of the vocal tract (formants F1, F2, ...). The order of the model is specified by # of coefficients.
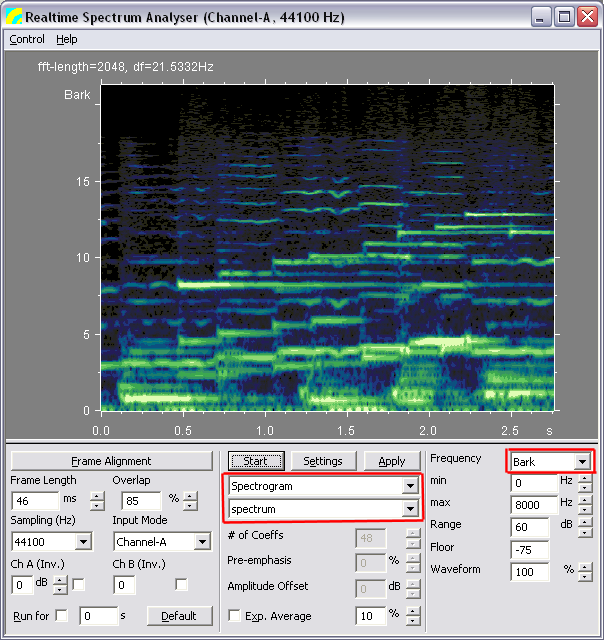
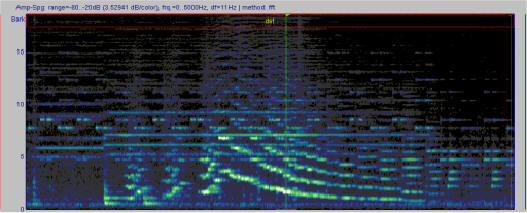
Spectrogram Display
Sound file management
Segmentation and Annotations
STx uses segments to address a part of a sound file.
- annotations for each segment can be set
- templates can be used to define annotation variables and default values
- annotations can be stored with the project (unlinked) or with each sound file (linked)
Tools for Segmentation and Annotation:
Automatic Segmentation
STx can interface with the BAS WebMAUS service to automatically segment a sound file based on a transcription and the sound file data. This feature was introduced in STx 5.0.
Visualization, labeling and annotation of sound data in the time domain, narrow segmentation
(e.g. phonetic transcription, full Unicode support)

Frequency analysis (FFT, DFT, Wavelet, Wigner)
Spectrogram - Visualization in Time-Frequency Plane
- large set of time-frequency transformations: FFT, DFT, Cepstrum, LPC, Wavelet, Wigner
- time synchronous display of spectrogram, waveform and parameters (e.g. fundamental freuquency track, formant tracks, rms)
- labeling and annotation of time-varying signals by means of spectrograms (in the frequency domain)
- sectioner - display spectrum at selected time positions
FFT Spectrogram
Quasi-continuous Wavelet-Transform

Wavelet Time-Phase Diagram:
The picture shows the comparison of partial #8 of 4 different music strings.
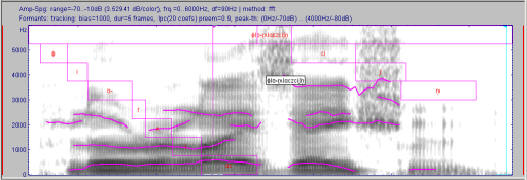
Narrow Band Spectrogram with formant tracks (overlayed) and f0 track

Spectral Smoothing
- Cepstrum Analysis: free selection of order (liftering)
- Linear Prediction Coding (LPC) Analysis: free selection of model order
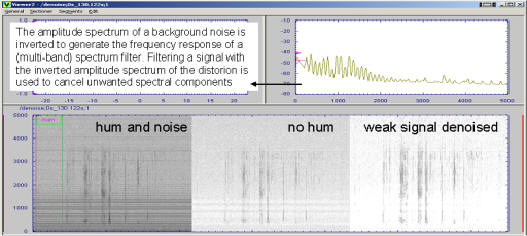
De-noising, signal enhancement
spectral subtraction, frame averaging, signal expansion
Auditory perception modelling - (Computational Hearing)
Comparison of auditory model with LPC-model (for speech)
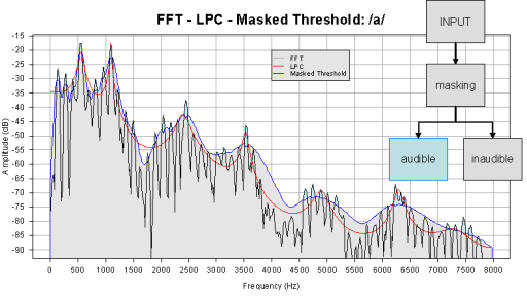
Simultaneous Masking - Over-Masking: spectral relevance

Order Analysis
To identify gear orders in a multiple motor component environment a specific method for the generation of order spectrograms has been implemented. The method applies smoothing on the rpm-signal and uses re-sampling as well as the Discrete Fourier Transform (DFT) in combination with the anti aliasing filter to create order analysis spectrograms at reasonable computational cost.
STx Sequencer
The Sequencer is a tool to combine synthetic signals and soundfile segments to a virtual signal stream. Originally it was designed, to create test signals for audio experiments.
For more details see: STx-Sequencer.pdf
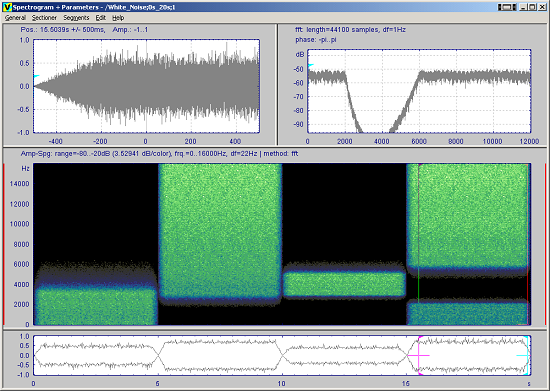
The spectrogram shows from left to right the real time filtering of white noise: Lowpass, Highpass, Bandpass and Bandstop